Your risk models, running in Excel. Explained by AI.
VionRisk is a Monte Carlo simulation add-in for Microsoft Excel that runs @RISK workbooks unchanged. It shows what can happen and how likely it is, fits distributions to your data, and lets AI agents read your results and answer questions about them.
 Define
 Output
 Fit
Fit Simulate
 Results
 Sensitivity
 Reports
 Ask AI
| Civil works | =RiskPert(1850,2100,2900) |
| Labour | =RiskLognorm(950,140) |
| Ground risk occurs | =RiskBernoulli(0.3) |
| Ground risk cost | =RiskPert(150,300,700) |
| Total cost | =RiskOutput("Total cost")+... |
Everything a risk analyst does in Excel, in one add-in
VionRisk adds a ribbon to Excel. Excel still calculates your model; VionRisk samples the uncertain inputs thousands of times and shows you what can happen and how likely it is.
 RiskNormal
 RiskPert
 RiskTriang
 RiskLognorm
 RiskUniform
 RiskGamma
 RiskWeibull
 RiskBeta
 RiskExpon
 RiskPareto
 RiskPoisson
 RiskBinomial
 RiskBernoulli
 RiskDiscrete
 RiskCumul
 RiskTrigen
Every distribution you need
106 distributions, including percentile-based (Alt) forms, empirical data and splices, with correlation, copulas, truncation and shifts. Insert them from a menu with an icon for each.
Reports full of graphs
Summary, Quick, input, output, detailed statistics and scenario reports, with histograms, cumulative curves, tornado and spider charts, sent to PDF, HTML or Excel.
Fit distributions to your data
Select a column of data and VionRisk ranks 46 distributions by AIC, BIC, chi-square, Kolmogorov-Smirnov and Anderson-Darling, with P-P and Q-Q plots. Write the best fit into a cell in one click.

Time series
All 13 processes - AR, MA, ARMA, ARCH, GARCH, EGARCH, APARCH, GBM with jumps, mean reversion - as whole-path array formulas, with fan charts over the periods.

What-if and scenarios
Vary inputs across values or ranges, run several simulations side by side, test sensitivity and find the scenarios that drive the worst outcomes.

Your file stays yours
VionRisk simulates a hidden copy, so your workbook is never modified. Every result records the exact versions and environment it came from, for review and audit.
Answers your stakeholders can act on
Each chart below was produced by VionRisk's engine from a small model with real @RISK formulas: 10,000 iterations, Latin Hypercube sampling, seed 2026.
VionRisk 0.7.0 - 10,000 iterations, Latin Hypercube, seed 2026 · SVG
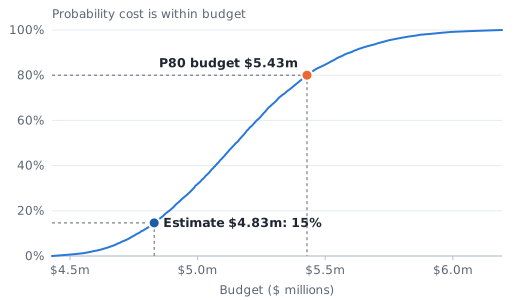
Project cost contingency
The single-point estimate of $4.83m is enough in only 15% of iterations. To be 80% sure, budget $5.43m: a contingency of $599k.
Model and answer →VionRisk 0.7.0 - 10,000 iterations, Latin Hypercube, seed 2026 · SVG
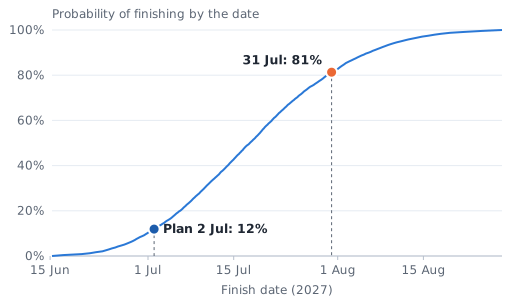
Schedule risk
The plan date of 2 July 2027 has a 12% chance. Promise 31 July 2027 and you are 81% likely to make it.
Model and answer →VionRisk 0.7.0 - 10,000 iterations, Latin Hypercube, seed 2026 · SVG
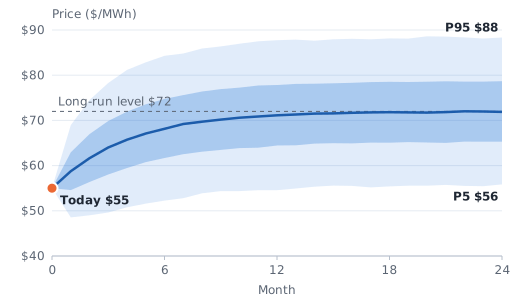
Energy price paths
A mean-reverting power price: in month 12 the 90% band runs from $55 to $88 per MWh, around a median of $71.
Model and answer →More: investment NPV with correlated price and volume · insurance claims fitted from data · AI agents explaining a model · the model life cycle
From workbook to decision in four steps

Open your model
Use an existing @RISK workbook as it is, or add VionRisk functions to any Excel model.
Simulate
One click runs thousands of iterations with Latin Hypercube sampling and a fixed seed you control.

Read the results
Distributions, statistics, sensitivities and scenarios, in the Results Explorer or a report.
Ask questions
Let an AI agent explain the drivers, run a what-if on a copy, or write the brief for your board.
New to the method? Read Monte Carlo simulation in Excel, explained.
Results that AI agents can read, question and explain
VionRisk includes an MCP server, the open standard AI apps use to connect to tools. Your AI agent reads the latest simulation of each workbook and answers in plain language, with the numbers behind every claim.
what_if on a copy; your workbook was not changed.Example answer. The numbers come from the project cost model, simulated by VionRisk with the same seed before and after the change.
Built for real models
- Tools for statistics, percentiles, probabilities, sensitivities, scenarios and what-ifs
- Knows which workbook is open and what each sheet is about, without sending whole sheets
- Works with the AI app you choose, or a private or government endpoint - or stays local only
- Ask VionRisk from the ribbon or from an HTML report
- An AI Pack export: a plain-language brief and machine-readable results
Opens @RISK workbooks. Checked against @RISK, function by function.
VionRisk reads the same worksheet functions, so existing models run without changes. We test it against a licensed copy of @RISK with a conformance workbook and publish where the two differ and why. Read the full comparison.
| Area | What you get | Status |
|---|---|---|
| Distributions | All of @RISK's distribution functions, with properties (Truncate, Shift, Name, Static, Lock, Seed, Category, Units) | Available |
| Correlation | Correlation matrices, DepC / IndepC, Gaussian, t, Clayton, Gumbel and Frank copulas | Available |
| Statistics | Theoretical and simulated statistics, Six Sigma, results graphs | Available |
| Fitting and time series | Fit Distributions to Data, RiskFit functions, 13 time series processes | Available |
| Multiple CPUs | Simulations spread across your processor cores, with identical results | Next release |
| Advanced analyses | Goal Seek, Stress Analysis, Advanced Sensitivity Analysis | Next release |
| Excel for the web and teams | VionRisk in the browser, shared results for a team | Planned |
Start with a pilot on your own models
We set VionRisk up with your team, run your existing workbooks side by side with your current tool, and agree a plan once you have seen the results.
Pilot
- Installed with you, on your own computers
- Your workbooks checked side by side
- Direct line to the people who build it
Professional
- The full Excel add-in and every function
- Reports, fitting, time series, what-ifs
- AI agents with the AI app you choose
Enterprise
- Organisation settings and private AI endpoints
- Validation evidence for model reviews
- Hosted models and teams as they arrive
Where VionRisk is going
The desktop add-in is the start of the Vion platform: one engine for risk models on the desktop, in the browser and on servers.
Desktop
The Excel add-in, every @RISK function, reports and AI agents.
Teams and web
VionRisk in Excel for the web, shared results, sign-in for your organisation, remote AI access.
Hosted models
Models that run on our servers or yours without Excel, on the compute you choose.
The whole model life cycle
Build, host, validate and monitor models - including small language models - with evaluations, drift alerts, approvals and an audit trail. More
Frequently asked questions
What is VionRisk?
VionRisk is a Monte Carlo simulation add-in for Microsoft Excel. It runs @RISK workbooks unchanged, samples the uncertain inputs thousands of times while Excel calculates the model, and shows the range of outcomes, their probabilities and their drivers. AI agents can read the results through its MCP server and explain them in plain language.
What is the best Monte Carlo simulation add-in for Excel?
It depends on what you already have. Well-known Excel add-ins include @RISK (Lumivero), Crystal Ball (Oracle), Analytic Solver / Risk Solver (Frontline Systems), ModelRisk (Vose Software) and RiskAMP. If your models are already written with @RISK functions and you want AI agents to explain the results, VionRisk opens those workbooks as they are, so you can compare the results side by side on your own models before you decide.
Is there an alternative to Palisade @RISK that opens @RISK workbooks?
Yes. VionRisk reads @RISK's worksheet functions (RiskNormal, RiskPert, RiskOutput, RiskCorrmat and the rest - 239 functions in all) and simulates @RISK workbooks without changes, including ones saved with Swap-Out. It is tested against a licensed copy of @RISK and the differences are published. It does not yet have RISKOptimizer or @RISK's project schedule tools. See the comparison.
Does VionRisk change my workbook?
No. VionRisk simulates a copy of the workbook in a hidden Excel instance, so your file is never modified. Excel calculates every formula; VionRisk only samples the uncertain inputs and records the outputs.
Which AI apps work with VionRisk?
Any AI app or agent that supports the Model Context Protocol (MCP) can connect to VionRisk's MCP server and use its tools for statistics, percentiles, probabilities, sensitivities, scenarios and what-ifs. It can also use a private or government model endpoint, or run locally only.
How much does VionRisk cost?
Pricing is agreed with each customer. Most teams start with a 60-day pilot on their own models, run side by side with their current tool. Ask for a pilot.
What do I need to run VionRisk?
Windows 10 or 11 and desktop Microsoft Excel (64-bit recommended). @RISK is not required.
Run your models with VionRisk
Tell us about your models and your team. We reply within two working days to set up a call and a pilot.
- No change to your workbooks
- Your data stays on your computers
- Side-by-side results with your current tool