Use cases

Quantitative risk analysis in Excel, in seven models

Quantitative risk analysis puts numbers on uncertainty: each uncertain input becomes a probability distribution, a Monte Carlo simulation runs the model thousands of times, and the result is the chance of each outcome - not a single guess.

Every model below is a few cells with real @RISK-compatible formulas. VionRisk's engine simulated each one (10,000 iterations, Latin Hypercube sampling, seed 2026, VionRisk 0.7.0); the charts and every number on this page come from those runs.

Cost contingency

Project cost contingency: what budget makes you 80% sure?

A capital project has four cost lines with three-point estimates and two risk events that may or may not happen. Adding the most likely values gives a single-point estimate of $4.83m. The question for the steering group is how much contingency to hold.

CellItemFormula
B1Design ($k)=VRPert(420,480,610)
B2Civil works ($k)=VRPert(1850,2100,2900)
B3Equipment ($k)=VRTriang(1200,1300,1650)
B4Labour ($k)=VRLognorm(950,140)
B5Ground risk occurs=VRBernoulli(0.3)
B6Ground risk cost ($k)=VRPert(150,300,700)
B7Permit delay occurs=VRBernoulli(0.2)
B8Permit delay cost ($k)=VRTriang(80,200,450)
B9Total cost ($k)=VROutput("Total cost")+SUM(B1:B4)+B5*B6+B7*B8
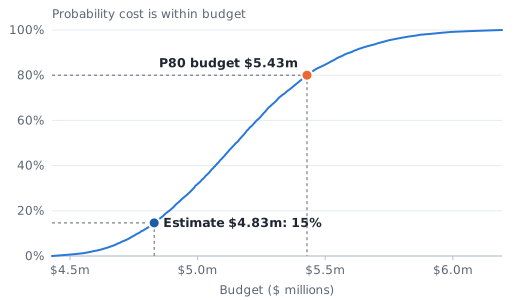
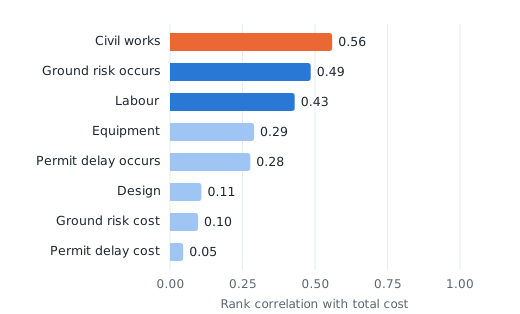
The answer: the single-point estimate is enough in only 15% of iterations. A budget of $5.43m (the P80) is enough in 80%: a contingency of $599k, or 12.4% of the estimate. The spread comes mostly from civil works, the ground risk and labour, so that is where to reduce uncertainty first.

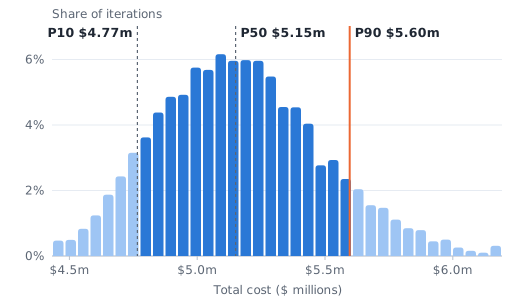
Why the estimate falls short: it ignores the risk events and the long right tails of the cost lines. P10 is $4.77m, P50 $5.15m, P90 $5.60m.

Budget $5.43m to be 80% sure - $599k above the estimateThe single-point estimate of $4.83m is enough in only 15% of iterations
Cumulative probability of total project costProbability the project costs no more than a given budget. The single-point estimate $4.83m is enough in 15% of iterations; a budget of $5.43m (P80) is enough in 80%.0%20%40%60%80%100%$4.5m$5.0m$5.5m$6.0mBudget ($ millions)Probability cost is within budgetEstimate $4.83m: 15%Estimate $4.83m: 15%P80 budget $5.43mP80 budget $5.43m

VionRisk 0.7.0 - 10,000 iterations, Latin Hypercube, seed 2026 · SVG

Total cost lands between $4.77m and $5.60m in 8 of 10 iterationsProject cost model - dark blue bars: the P10 to P90 range; orange: P90
Histogram of total project cost10,000 simulated totals. P10 $4.77m, P50 $5.15m, P90 $5.60m; the single-point estimate $4.83m sits in the low tail.0%2%4%6%$4.5m$5.0m$5.5m$6.0mTotal cost ($ millions)Share of iterations$4.43m to $4.48m: 0.5% of iterations$4.48m to $4.53m: 0.5% of iterations$4.53m to $4.58m: 0.8% of iterations$4.58m to $4.63m: 1.2% of iterations$4.63m to $4.68m: 1.9% of iterations$4.68m to $4.73m: 2.4% of iterations$4.73m to $4.77m: 3.1% of iterations$4.77m to $4.82m: 3.6% of iterations$4.82m to $4.87m: 4.4% of iterations$4.87m to $4.92m: 4.9% of iterations$4.92m to $4.97m: 4.9% of iterations$4.97m to $5.02m: 5.8% of iterations$5.02m to $5.07m: 5.7% of iterations$5.07m to $5.12m: 6.2% of iterations$5.12m to $5.17m: 6.0% of iterations$5.17m to $5.21m: 6.0% of iterations$5.21m to $5.26m: 6.0% of iterations$5.26m to $5.31m: 5.5% of iterations$5.31m to $5.36m: 4.5% of iterations$5.36m to $5.41m: 4.5% of iterations$5.41m to $5.46m: 4.0% of iterations$5.46m to $5.51m: 2.8% of iterations$5.51m to $5.56m: 2.9% of iterations$5.56m to $5.61m: 2.4% of iterations$5.61m to $5.65m: 2.0% of iterations$5.65m to $5.70m: 1.6% of iterations$5.70m to $5.75m: 1.5% of iterations$5.75m to $5.80m: 1.1% of iterations$5.80m to $5.85m: 0.9% of iterations$5.85m to $5.90m: 0.8% of iterations$5.90m to $5.95m: 0.4% of iterations$5.95m to $6.00m: 0.5% of iterations$6.00m to $6.05m: 0.3% of iterations$6.05m to $6.09m: 0.2% of iterations$6.09m to $6.14m: 0.1% of iterations$6.14m to $6.19m: 0.3% of iterationsP10 $4.77mP50 $5.15mP90 $5.60m

VionRisk 0.7.0 - 10,000 iterations, Latin Hypercube, seed 2026 · SVG

Civil works, the ground risk and labour drive the cost mostRank correlation of each input with total cost (Spearman) - the largest in orange, the next two in blue
Tornado chart of rank correlations with total costSpearman rank correlation of each input with total cost: Civil works ($k) 0.56; Ground risk occurs 0.49; Labour ($k) 0.43; Equipment ($k) 0.29; Permit delay occurs 0.28; Design ($k) 0.11; Ground risk cost ($k) 0.10; Permit delay cost ($k) 0.050.000.250.500.751.00Rank correlation with total costCivil worksCivil works ($k): 0.560.56Ground risk occursGround risk occurs: 0.490.49LabourLabour ($k): 0.430.43EquipmentEquipment ($k): 0.290.29Permit delay occursPermit delay occurs: 0.280.28DesignDesign ($k): 0.110.11Ground risk costGround risk cost ($k): 0.100.10Permit delay costPermit delay cost ($k): 0.050.05

VionRisk 0.7.0 - 10,000 iterations, Latin Hypercube, seed 2026 · SVG

Investment NPV

Capital investment NPV with correlated price and volume

A new product line needs an uncertain investment and earns five years of cash flow. Price and volume are uncertain and linked: when the price is high, fewer units sell. A VRCorrmat matrix sets a rank correlation of -0.6 between them (the simulated rank correlation is -0.58).

CellItemFormula
B1Price ($ per unit)=VRNormal(50,6,VRCorrmat(Corr!$A$1:$B$2,1))
B2Volume (thousand units a year)=VRTriang(70,100,120,VRCorrmat(Corr!$A$1:$B$2,2))
B3Unit cost ($)=VRPert(28,31,37)
B4Fixed cost ($k a year)950
B5Investment ($k)=VRPert(1800,2000,2600)
B6Cash flow ($k a year)=B2*(B1-B3)-B4
B7NPV at 9%, 5 years ($k)=VROutput("NPV")+NPV(9%,B6,B6,B6,B6,B6)-B5

Sheet Corr, A1:B2: the correlation matrix {1, -0.6; -0.6, 1} - a higher price comes with lower volume.

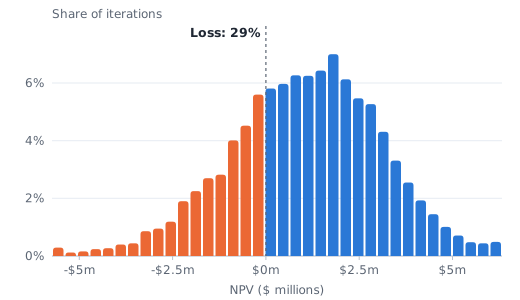
The answer: the expected NPV is $1.05m, but there is a 29% chance the investment loses money; the 90% range runs from -$2.36m to $4.23m.

Why the correlation matters: the same model with price and volume independent gives a 33% chance of loss and a standard deviation of $2.47m instead of $2.03m. Leaving out a real link between inputs misstates the risk - here it overstates it, because a high price partly offsets a low volume.

29% chance the investment loses moneyNPV of the investment - orange bars: NPV below zero; mean $1.05m
Histogram of project NPVNPV from 10,000 iterations: mean $1.05m; 29% of iterations lose money (NPV below zero).0%2%4%6%-$5m-$2.5m$0m$2.5m$5mNPV ($ millions)Share of iterations-$5.73m to -$5.40m: 0.3% of iterations-$5.40m to -$5.06m: 0.1% of iterations-$5.06m to -$4.73m: 0.2% of iterations-$4.73m to -$4.39m: 0.2% of iterations-$4.39m to -$4.06m: 0.3% of iterations-$4.06m to -$3.72m: 0.4% of iterations-$3.72m to -$3.39m: 0.4% of iterations-$3.39m to -$3.05m: 0.9% of iterations-$3.05m to -$2.72m: 0.9% of iterations-$2.72m to -$2.38m: 1.2% of iterations-$2.38m to -$2.05m: 1.9% of iterations-$2.05m to -$1.71m: 2.2% of iterations-$1.71m to -$1.38m: 2.7% of iterations-$1.38m to -$1.04m: 2.8% of iterations-$1.04m to -$0.71m: 4.0% of iterations-$0.71m to -$0.37m: 4.5% of iterations-$0.37m to -$0.04m: 5.6% of iterations-$0.04m to $0.30m: 5.8% of iterations$0.30m to $0.63m: 6.0% of iterations$0.63m to $0.97m: 6.3% of iterations$0.97m to $1.30m: 6.2% of iterations$1.30m to $1.64m: 6.4% of iterations$1.64m to $1.97m: 7.0% of iterations$1.97m to $2.31m: 6.1% of iterations$2.31m to $2.64m: 5.5% of iterations$2.64m to $2.98m: 5.3% of iterations$2.98m to $3.31m: 4.3% of iterations$3.31m to $3.65m: 3.3% of iterations$3.65m to $3.98m: 2.5% of iterations$3.98m to $4.32m: 1.9% of iterations$4.32m to $4.65m: 1.5% of iterations$4.65m to $4.99m: 1.0% of iterations$4.99m to $5.32m: 0.7% of iterations$5.32m to $5.66m: 0.5% of iterations$5.66m to $5.99m: 0.4% of iterations$5.99m to $6.33m: 0.5% of iterationsLoss: 29%

VionRisk 0.7.0 - 10,000 iterations, Latin Hypercube, seed 2026 · SVG

Schedule risk

Schedule risk: what is the chance to finish by a date?

Design and procurement run one after the other while permits run alongside; construction starts when both are done, then commissioning, plus days lost to weather. The plan, built from the most likely durations, finishes on 2 July 2027 for a start on 4 January 2027.

CellItemFormula
B1Design (days)=VRPert(25,30,50)
B2Permits (days, alongside design and procurement)=VRTriang(20,30,70)
B3Procurement (days)=VRPert(30,40,65)
B4Construction (days)=VRPert(80,95,140)
B5Commissioning (days)=VRTriang(10,14,25)
B6Weather days lost=VRPoisson(4)
B7Duration (days)=VROutput("Duration")+MAX(B1+B3,B2)+B4+B5+B6

Start 4 January 2027; calendar days. Finish date = start + B7.

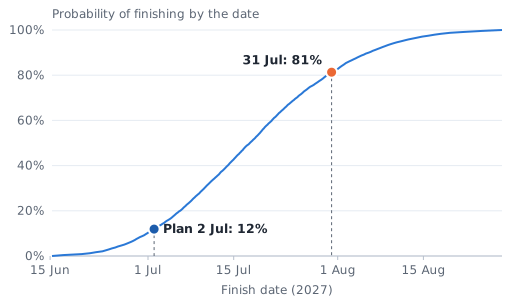
The answer: the plan date has a 12% chance. The median finish is 18 July 2027; 31 July 2027 has a 81% chance, a date the team can commit to. The largest driver is construction.

Plans built from most likely durations are usually optimistic: with parallel paths, the later of two paths sets the start of the next task (merge bias), and delays add up while savings are capped.

The plan date has a 12% chance; 31 July has 81%Probability of finishing by each date - start 4 January 2027
Cumulative probability of the finish dateProbability of finishing by each date. The plan date 2 July 2027 is met in 12% of iterations; 31 July 2027 in 81%; P80 finish 30 July 2027.0%20%40%60%80%100%15 Jun1 Jul15 Jul1 Aug15 AugFinish date (2027)Probability of finishing by the datePlan 2 Jul: 12%Plan 2 Jul: 12%31 Jul: 81%31 Jul: 81%

VionRisk 0.7.0 - 10,000 iterations, Latin Hypercube, seed 2026 · SVG

Insurance and claims

Claims severity fitted from data

An insurer has a column of past claim amounts and wants a distribution for the size of the next claim, to price an excess-of-loss layer above $50k. VionRisk's Fit Distributions to Data fits every applicable distribution by maximum likelihood and ranks them.

Sample data: the 500 claims here are generated, not real claims (mean $11,993), so the example can be published and repeated.

RankFitted functionAICK-SA-D
1=VRPearson6(1.66118,3.56872,17799.2,VRShift(487.4))10,315.70.01760.112
2=VRLognorm(12006,14651.3,VRShift(75.8638))10,316.00.02290.228
3=VRBurr12(487.4,13255.3,1.41118,1.89035)10,316.70.02140.179
4=VRJohnsonSB(4.80652,1.02329,117.803,839044)10,317.90.02260.208
5=VRJohnsonSU(-16.8069,1.04715,75.8638,0.00162902)10,318.00.02290.228
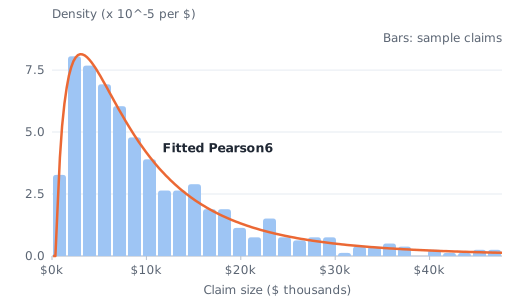
The answer: the best fit by AIC is Pearson6, written into a cell as VRPearson6(1.66118,3.56872,17799.2,VRShift(487.4)). Under it, 1 claim in 100 exceeds $67k, 2.2% of claims reach the layer, and the layer pays an expected $594 per claim.

AIC rewards fit and penalises extra parameters; check the ranking with the K-S and A-D statistics and the P-P and Q-Q plots before you rely on a tail. 37 distributions were fitted to these data.

Pearson6 fits the sample claims best (AIC), out of 37 distributionsHistogram of 500 generated sample claims with the fitted density - sample data, not real claims
Histogram of 500 sample claims with the fitted density500 generated sample claims (bars) and the best fit by AIC, VRPearson6(1.66118,3.56872,17799.2,VRShift(487.4)) (line).0.02.55.07.5$0k$10k$20k$30k$40kClaim size ($ thousands)Density (x 10^-5 per $)$0 to $1,589: 26 claims$1,589 to $3,178: 64 claims$3,178 to $4,766: 61 claims$4,766 to $6,355: 55 claims$6,355 to $7,944: 48 claims$7,944 to $9,533: 38 claims$9,533 to $11,122: 31 claims$11,122 to $12,710: 21 claims$12,710 to $14,299: 21 claims$14,299 to $15,888: 23 claims$15,888 to $17,477: 15 claims$17,477 to $19,066: 15 claims$19,066 to $20,654: 9 claims$20,654 to $22,243: 6 claims$22,243 to $23,832: 12 claims$23,832 to $25,421: 6 claims$25,421 to $27,010: 5 claims$27,010 to $28,598: 6 claims$28,598 to $30,187: 6 claims$30,187 to $31,776: 1 claims$31,776 to $33,365: 3 claims$33,365 to $34,953: 3 claims$34,953 to $36,542: 4 claims$36,542 to $38,131: 3 claims$39,720 to $41,309: 2 claims$41,309 to $42,897: 1 claims$42,897 to $44,486: 1 claims$44,486 to $46,075: 2 claims$46,075 to $47,664: 2 claimsFitted Pearson6Bars: sample claims

VionRisk 0.7.0 - Fit Distributions to Data (maximum likelihood), ranked by AIC · SVG

Energy and commodities

Energy price paths: a mean-reverting time series

A buyer of power wants to know the range of monthly prices over the next two years. Power prices tend to pull back toward a long-run level, so the model uses VRBMMR (Brownian motion with mean reversion), one of VionRisk's 13 time series functions, entered as an array formula across 24 monthly cells.

CellItemFormula
B1Price, months 1-24 ($/MWh){=VRBMMR(72,7,0.25,55)}

An array formula over 24 cells (B1:Y1), one per month: long-run level $72, volatility 7 a month, reversion speed 0.25, starting from $55.

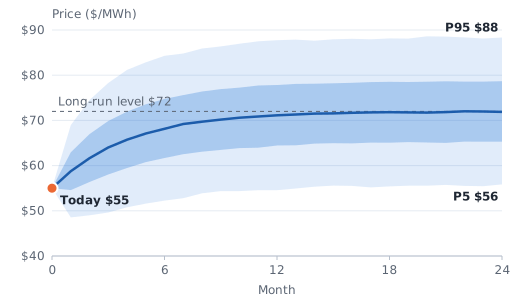
The answer: from $55 today the median price climbs to $71 in month 12, near the long-run $72. The 90% band in month 12 runs from $55 to $88, and there is a 9% chance the month-12 price is above $85. Hedge decisions can be set against that band, not a single forecast.
Prices pull back toward $72, but month 12 still spans $55 to $88Power price, mean-reverting (VRBMMR) - bands: P5-P95 and P25-P75, line: median
Fan chart of a mean-reverting power price over 24 monthsMonthly price paths from {=VRBMMR(72,7,0.25,55)}: the median rises from $55 toward $72; in month 12 the P5-P95 band is $55 to $88.$40$50$60$70$80$9006121824MonthPrice ($/MWh)P5 to P95 bandP25 to P75 bandLong-run level $72P95 $88P5 $56Today $55

VionRisk 0.7.0 - 10,000 iterations, Latin Hypercube, seed 2026 · SVG

AI agents

AI agents explaining a model

After a simulation, VionRisk's MCP server gives an AI agent the latest results of each workbook. The agent answers with the numbers behind every claim and can test a change on a copy of the model; the user's workbook is never changed.

The 18 tools an agent can call:

  • search_functions
  • fit_distribution
  • list_simulations
  • get_brief
  • describe_workbook
  • read_region
  • get_model
  • get_statistics
  • probability
  • percentile
  • sensitivity
  • scenario
  • conditional_statistics
  • compare_simulations
  • what_if
  • what_if_history
  • get_samples
  • assumptions_check

Connect the AI app you choose, a private or government endpoint, or keep it local only.

What is the chance the project costs more than $5.5m, and what drives it?
There is a 15% chance total cost exceeds $5.5m. The main drivers are civil works (rank correlation 0.56), the ground risk (0.49) and labour (0.43).
What if a ground investigation cut the chance of the ground risk from 30% to 10%?
I ran what_if on a copy with =VRBernoulli(0.1) in B5 and the same seed. The chance of exceeding $5.5m falls to 10% and the P80 budget to $5.34m, $87k lower. Your workbook was not changed.

Example answers; the numbers come from the project cost model above.

On the roadmap

The model life cycle: build, host, validate, monitor

Models do not stop at the first run. VionRisk is growing into a platform that treats every model the same way - a cost model, a pricing model or a small language model: build it, host it, validate it with a versioned test suite, monitor it against what actually happens, and keep an audit trail of every change and approval.

Parts exist today: the conformance suite, the assumptions check against observed data, exact maths with documented assumptions, and the environment stamped on every output. Hosting, monitoring and small language models are on the roadmap.

What exists today and what is planned →

  1. Build

    Today: Excel models with 239 functions, fitting and time series.

  2. Validate

    Today: conformance tests against @RISK; the assumptions check.

  3. Host and monitor

    Roadmap: hosted models, drift alerts, approvals, small language models.

Bring one of your own models

In a pilot we run your existing workbooks side by side with your current tool, on your computers, and you see the answers your stakeholders would get.

Start a pilot